Average Home Price in Albuquerque NM Market Statistics
What is the Average Home Price In Albuquerque, NM in 2025?
 The average home price in Albuquerque is $ 446,904 for August 2025, and the average home price in Albuquerque is $420,448 for the trailing twelve months (TTM). Read more and view the historical average home price in Albuquerque, NM. In addition, check out this page for the median home price in Albuquerque.
Welcome to Albuquerque, New Mexico, a city with a rich cultural heritage and a thriving real estate market. If you’re considering a move to the Land of Enchantment or simply interested in the local housing trends, you’ve come to the right place. In this article, we’ll explore the secrets of Albuquerque’s real estate scene, focusing on average home prices, current and historical.
We’ll delve into the average home prices, providing valuable insights for buyers and sellers. Whether you’re looking for a cozy Adobe-style home or a modern, newer home, understanding the local market trends is critical to making informed decisions.
Join us as we explore the average home price in Albuquerque, NM. Let’s dive in and uncover the captivating stories behind Albuquerque’s average home prices and real estate trends.
Overview of the Real Estate Market in Albuquerque
Albuquerque’s real estate market is a dynamic tapestry woven with a blend of traditional adobe homes, contemporary designs, and Southwestern charm. The city’s housing options cater to a diverse range of preferences. You will find historic neighborhoods steeped in culture to modern developments that offer a taste of urban living. Various factors, including location, property size, amenities, and the economic climate, influence the average home price in Albuquerque.
As you navigate Albuquerque’s neighborhoods, you’ll encounter a mix of architectural styles reflecting the city’s rich history and evolving identity. From the adobe buildings that pay homage to the region’s Native American and Spanish heritage to the sleek, modern structures that symbolize Albuquerque’s embrace of innovation, each home tells its own story. Understanding the nuances of these neighborhoods is essential for anyone looking to buy or sell a property in Albuquerque.
Albuquerque’s real estate market is characterized by a balance between supply and demand, with fluctuations influenced by job growth, population trends, and interest rates. Compared to other major metropolitan areas in the United States, its affordability has made it an attractive destination for individuals and families seeking a high quality of life without the exorbitant price tag. As we delve deeper into the average home prices in Albuquerque, we’ll uncover the intricacies that shape the real estate landscape of this captivating city.
2025 Average Sales Price
| Month | Monthly | % YOY Change | TTM | % YOY Change |
| January | $396,746 | +6.2 | $409,272 | +3.8 |
| February | $386,595 | +1.6 | $409,728 | +3.5 |
| March | $433,939 | +10.3 | $413,117 | +3.7 |
| April | $416,261 | +2.1 | $414,047 | +3.8 |
| May | $425,567 | +2.9 | $414,780 | +3.5 |
| June | $426,229 | +.56 | $415,565 | +3.4 |
| July | $439,363 | +5.3 | $417,504 | +3.7 |
| August | $446,904 | +8.2 | $420,448 | +4.6 |
| September | ||||
| October | ||||
| November | ||||
| December |
Factors Influencing Home Prices in Albuquerque
The average home price in Albuquerque reflects the city’s unique blend of cultural heritage and economic opportunities. One of the key factors influencing property values in Albuquerque is location. Neighborhoods that offer proximity to amenities like parks, schools, shopping centers, and employment hubs tend to command higher prices. The allure of living in a neighborhood with a strong sense of community and convenient access to essential services can significantly impact the average home price.
Another factor that plays a crucial role in determining the average home price in Albuquerque is the condition and age of the property. While historic homes in neighborhoods like Old Town may hold sentimental value and architectural charm, newer developments like Northwest Albuquerque offer modern amenities and design elements that cater to contemporary lifestyles. The property’s age, size, and overall condition can influence a home’s value. Also, well-maintained homes often command higher prices than those needing extensive renovations.
In addition, economic factors such as interest rates, employment opportunities, and market trends also contribute to the fluctuations in the average home price in Albuquerque. The city’s steady job growth in healthcare, technology, and tourism sectors has bolstered its real estate market. Understanding how these external factors shape the local housing market is essential for buyers looking for a good investment and sellers aiming to maximize their property’s value.
2024 Average Sales Price
| Month | Monthly | % YOY Change | TTM | % YOY Change |
| January | $373,445 | +3.5 | $394,443 | +5.5 |
| February | $380,546 | +5.3 | $395,745 | +5.7 |
| March | $393,366 | +8.4 | $398,410 | +6.3 |
| April | $407,774 | +1.4 | $398,971 | +6.3 |
| May | $413,593 | +4.2 | $400,692 | +6.9 |
| June | $423,829 | +3.8 | $401,961 | +6.7 |
| July | $417,430 | +.017 | $402,595 | +6.0 |
| August | $413,204 | -1.9 | $401,879 | +4.2 |
| September | $408,279 | +1.7 | $402,578 | +4.4 |
| October | $412,138 | +6.3 | $404,167 | +3.8 |
| November | $409,435 | +3.6 | $405,264 | +2.6% |
| December | $417,956 | +7.9 | $408,055 | +3.7 |
2023 Average Sales Price
| Month | Monthly | % YOY Change | TTM | % YOY Change |
| January | $360,863 | +6.9 | $373,840 | +12.4 |
| February | $361,336 | +2.7 | $374,572 | +11.6 |
| March | $362,749 | -.3 | $374,714 | +10.1 |
| April | $402,246 | +3.8 | $375,272 | +8.7 |
| May | $396,857 | +.5 | $374,815 | +6.7 |
| June | $408,171 | +5.9 | $376,598 | +6.0 |
| July | $417,357 | +10 | $379,872 | +5.8 |
| August | $421,231 | +15.8 | $385,537 | +6.8 |
| September | $401,633 | +8.7 | $388,566 | +6.6 |
| October | $387,779 | +2.6 | $389,485 | +5.5 |
| November | $395,068 | +8.5 | $391,962 | +5.8 |
| December | $387,163 | +5.8 | $393,613 | +5.9 |
2022 Average Sales Price
| Month | Monthly | % YOY Change | TTM | % YOY Change |
| January | $337,592 | +12.9 | $332,717 | |
| February | $351,922 | +15.1 | $335,539 | |
| March | $363,946 | +20.1 | $340,419 | |
| April | $387,610 | +19.2 | $345,297 | |
| May | $394,901 | +21.0 | $351,218 | |
| June | $385,293 | +12.7 | $355,255 | |
| July | $379,393 | +12.0 | $358,995 | |
| August | $363,665 | +5.6 | $360,948 | |
| September | $369,385 | +10.9 | $364,369 | |
| October | $378,135 | +15.9 | $369,085 | |
| November | $364,144 | +4.3 | $370,625 | |
| December | $365,891 | +2.8 | $371,764 |
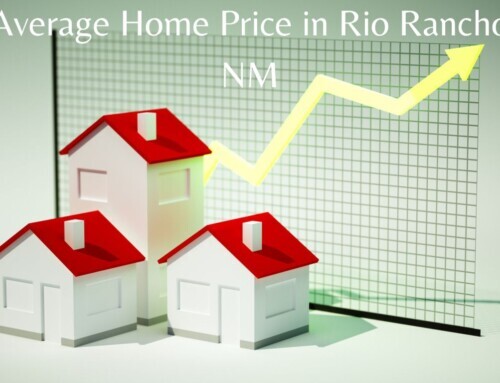
Historical Trends in the Albuquerque Home Price
To understand Albuquerque’s real estate market comprehensively, it’s essential to examine historical trends that have shaped the city’s average home prices over the years. By analyzing historical data, we can identify patterns, fluctuations, and key drivers that have influenced property values in Albuquerque. Understanding the historical context of the real estate market provides valuable insights for predicting future trends and making informed decisions in the present.
Over the past 20 years, Albuquerque has experienced a gradual appreciation of property values driven by population growth, economic development, and infrastructural improvements. Neighborhoods once considered up-and-coming have transformed into sought-after destinations, attracting buyers with unique character and lifestyle offerings. The historical trends in the average home price in Albuquerque reflect the city’s evolution into a dynamic real estate market that balances tradition with innovation.
By examining historical data on property sales, market trends, and economic indicators, individuals can better appreciate the factors influencing the average home price in Albuquerque, NM. From the impact of significant events like the housing market crash in 2008 to the resurgence of specific neighborhoods due to revitalization efforts, each chapter in Albuquerque’s real estate history contributes to the narrative of its present-day market dynamics. By learning from the past, individuals can make more informed decisions about their real estate endeavors in Albuquerque’s ever-evolving landscape.
| Year | Average Home Price in Albuquerque NM | Average Home Price in Albuquerque % YOY Change |
| 2023 | $393,613 | +5.9 |
| 2022 | $371,791 | +12.5 |
| 2021 | $330,420 | +11.95 |
| 2020 | $295,149 | +12.59 |
| 2019 | $262,156 | +7.90 |
| 2018 | $242,968 | +2.26 |
| 2017 | $237,593 | +3.50 |
| 2016 | $229,574 | +3.25 |
| 2015 | $222,351 | +1.71 |
| 2014 | $218,611 | +1.45 |
| 2013 | $215,488 | +4.91 |
| 2012 | $205,401 | +0.92 |
| 2011 | $203,534 | -6.74 |
| 2010 | $218,234 | +1.19 |
| 2009 | $215,677 | -7.63 |
| 2008 | $233,490 | -5.53 |
| 2007 | $247,136 | +7.9 |
| 2006 | $229,044 | +1.3 |
| 2005 | $206,430 | +10.6 |
| 2004 | $186,644 | +9.9 |
| 2003 | $169,887 | +3.8 |
| 2002 | $163,690 | +3.6 |
| 2001 | $157,944 | +1.6 |
| 2000 | $155,527 | +.05 |
Data For Average Albuquerque House Prices
You may wonder why our average house prices in Albuquerque differ from other sources. Our data is from the Greater Albuquerque Association of Realtors, and our average Albuquerque, New Mexico, housing prices are for the “sold price” of homes. In contrast, many sources utilize the “list price” of homes to determine the average home price. Our data is undoubtedly more accurate using the “sold” home prices than listing home prices. Also, our average Albuquerque house prices are for single-family “detached homes”. Thus, our data exclude townhomes, condos, and manufactured homes.
Our data does not include homes for sale by owner.
Furthermore, New Mexico is a nondisclosure state regarding the sale price of homes sold in New Mexico. In other words, it is tough for different sources to gather data on the sales price of a home in New Mexico. However, we can access the sold prices through the Southwest Multiple Listing System (SWMLS).
Frequently Asked Questions – FAQs
What is the average home price in Albuquerque?
The average home price is $446,904 for single-family detached homes in August 2025.
Are home prices dropping in Albuquerque?
No, Albuquerque house prices are increasing. The average home price in August 2025 was $446,904, representing a 8.2% year-over-year increase.